Market Share Simulator -Manual-
Table of contents
1.About Brand Loyalty
2.Screen Description
3.Start Simulation
4.Parameters Edit
5.Graph Image Output
6.Other Apps
7.Inquiry
1.About Brand Loyalty
Brand Loyalty is the percentage of customers who use the brand again.
Customers who did not use the brand again will use another brand next time.
If loyalty of brand A is "80%" and the number of customers is "100 people", Next time 80 people will use Brand A again, and 20 people will use Brand B.
Calculation is repeated in this condition, and you can observe change in the market share between the two brand.
Table of contents
2.Screen Description
Menu Button
Display following contents.
Display area
Graphic and Graphs are displayed here.
Tab Button
Switch between "Graphic", "Dynamic Graph" and "Static Graph". Reference
Start Button
Start Simulation. Become Stop Button during Simulation.
Reset Button
Stop Simulation and Reset the value.
Parameters
Current parameters.
Type Description
Graphic
Market Share is represented by the size of the Circle. When you start simulation, the size of the circle will change depending on the Market Share.
Dynamic Graph
Market Share is represented by the Line Graph. When you start simulation, Line Graph will display the current Market Share.
Static graph
Show Line Graph of the range of (0 ≦ n ≦ 500). You can scroll the graph horizontally by Flick.
Table of contents
3.Start Simulation
When you press "Start" Button, simulation that is based on the current parameters will be start.
You can pause the simulation by "Stop" Button.
You can reset the values by "Reset" Button.
Table of contents
4.Parameters Edit
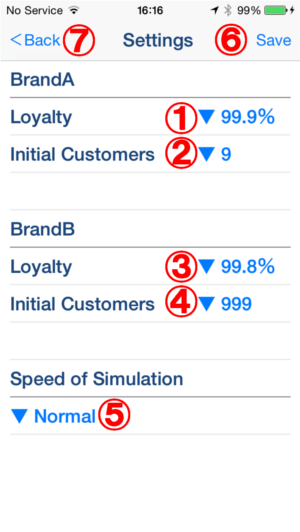
When you select "Settings" from "Menu", "Settings" Screen will be shown.
Settings Screen
Loyalty of Brand A
Entry field "Loyalty of Brand A".
Initial number of Customers of brand A
Entry field "Initial number of Customers of brand A".
Loyalty of Brand B
Entry field "Loyalty of Brand B".
Initial number of Customers of brand B
Entry field "Initial number of Customers of brand B".
Simulation Speed
Entry field "Simulation Speed"
Save Button
Save parameters and back to the previous page.
Back Button
Back to the previous page.
Table of contents
5.Graph Image Output
You can output Graph image that is range of (0 ≦ n ≦ 100) by selecting "Graph Image Output" from "Menu" Button.
Table of contents
6.Other Apps
Video 2 Music - Convert Video to Music File -
Video 2 CameraRoll - Save Movie of Home Videos to Camera Roll -
Active Camouflage Camera - Optical camouflage effect photo and movie maker! -
VIDEO
Comic Movie - Cartoon Movie and Animation Film Maker! -
VIDEO
Route Maker - Multiple Waypoints Route Planner for travel and business -
Retro Film - Retro Movie Maker Apps -
VIDEO
Polygon Art - 3D Polygon Effects Photo Editor! -
Abstract You! - Poster Color Abstract Painting Effects Free Photo Editor Apps -
Silhouette - Silhouette Effects And Image Blender Free Photo Editor Apps -
Comic Art - Comic, Cartoon, Graphic novel tone illustration Style Pop Art Photo Editor App -
dot ART - Dot, Mosaic, Pop Art Style Illustration Photo Editor App -
Impressionism - Impressionist-Style Oil Painting Art Photo Filter App -
Zen Painting - Japanese Style Painting / Ukiyo-e / Ink Painting Camera Filter App -
Copper Engrave - Copperplate Engraving/Etching Style Filter App -
Art Serigraphy - Contemporary / Modern Art Style Filter App -
PockeTraveL -Photo And Route Travel Log App-
ColorColl - Color Picker/Capture App for Collect World Color -
DivingLog - Scuba Diving LogBook App -
Population Simulator - The Population Model with Logistic Map -
7.Inquiry
Inquiry
App Page
Market Share Simulator App Page
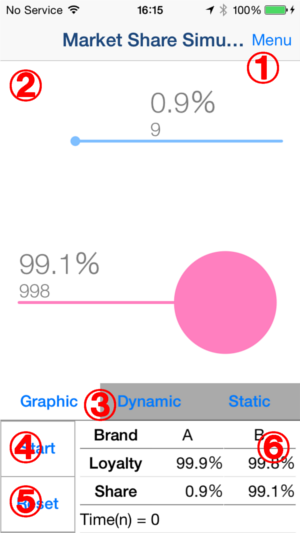
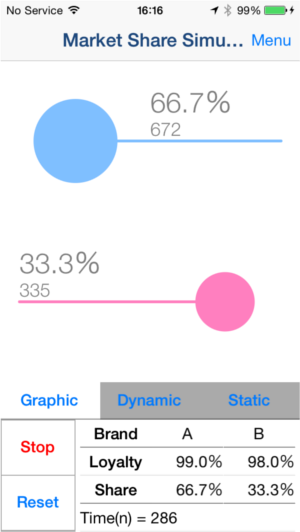
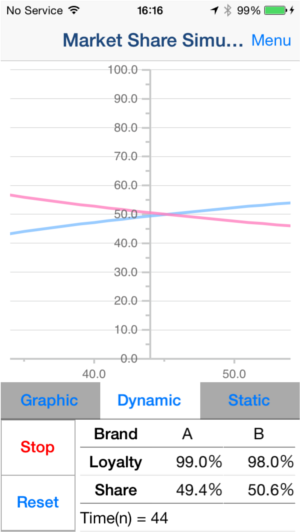
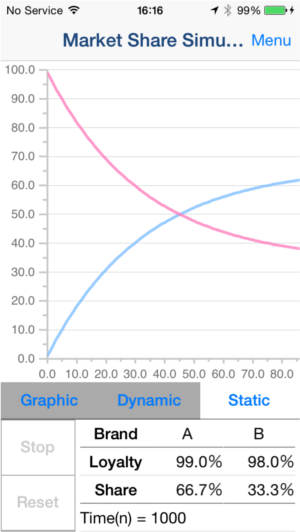 Table of contents
