2.Screen Description
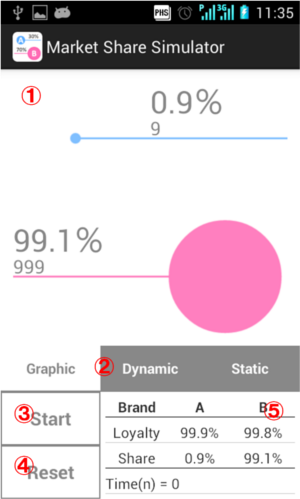
-
Display area
Graphic and Graphs are displayed here.
-
Tab Button
Switch between "Graphic", "Dynamic Graph" and "Static Graph". Reference
-
Start Button
Start Simulation. Become Stop Button during Simulation.
-
Reset Button
Stop Simulation and Reset the value.
-
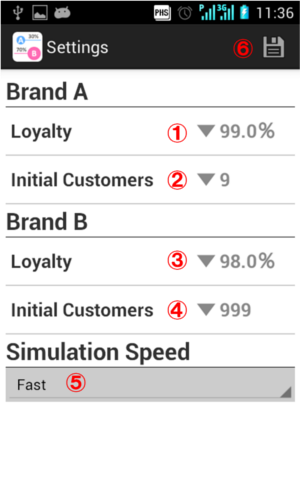
Parameters
Current parameters.
Menu
Show menu from "Option" Button at the top right of the screen or device lower.
- Manual
- Settings
- Open source licenses
Type Description
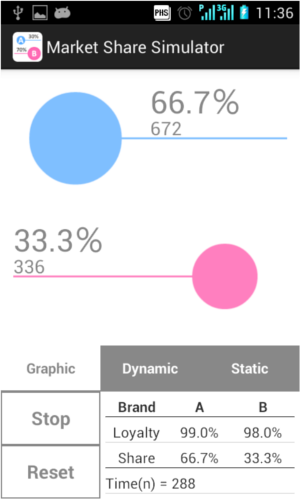
Graphic
Market Share is represented by the size of the Circle. When you start simulation, the size of the circle will change depending on the Market Share.
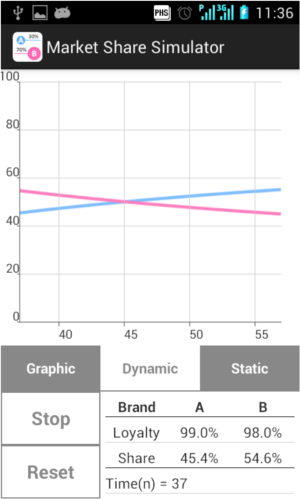
Dynamic Graph
Market Share is represented by the Line Graph. When you start simulation, Line Graph will display the current Market Share.
Static graph
Show Line Graph of the range of (0 ≦ n ≦ 500). You can scroll the graph horizontally by Flick.
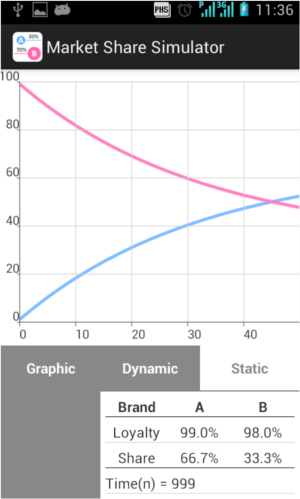 Table of contents
