1.What is Logistic Map?
The Logistic Map is the map that is generated from the Logistic Function that has been devised as a variation model of the population of an organism.
It is expressed by the following function.
X(n+1) = a・X(n)・(1-X(n))
In the above equation, the meaning of each symbol is as follows.
- n:Generation (n=1,2,3,...)
- X(n):Value obtained by normalizing the Population of Generation n-th(0≦X(n)≦1)
- a:Value obtained by normalizing the Reproductive Rates(0≦a≦4)
You can calculate the population of the next generation from a population of a certain generation by using this function. In addition, You can predict the variation of the population over the long term by calculating the population of individuals repeatedly in this function.
Pattern of Logistic Map
Logistic map vary widely depending on the value of "a".
- In case (0≦a≦1) → X(n) converges to 0.
- In case (1<a≦2) → X(n) converges to 1-(1/a).
- In case (2<a≦3) → X(n) converges to 1-(1/a) while oscillating.
- In case (3<a≦3.5699456・・・) → X(n) oscillate between the periodic point individual Power of 2
- In case (3.5699456・・・<a≦4) → X(n) Change irregularly.(Chaotic region)*It may become periodically by the value of a.
Please try to observe the changes of Logistic Map by changing the various initial values.
Table of contents
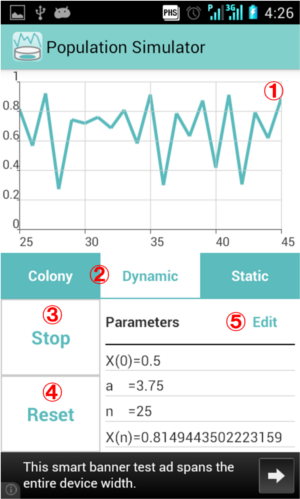
2.Screen Description
-
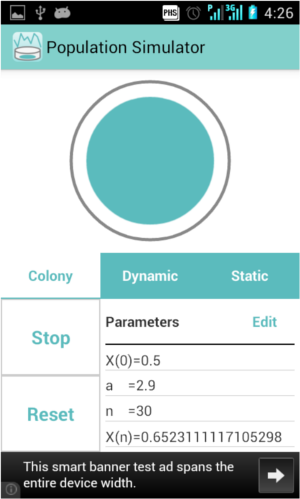
Display area
Colony and Graphs are displayed here.
-
Tab Button
Switch between "Colony", "Dynamic Graph" and "Static Graph". Reference
-
Start Button
Start Simulation. Become Stop Button during Simulation.
-
Reset Button
Stop Simulation and Reset the value.
-
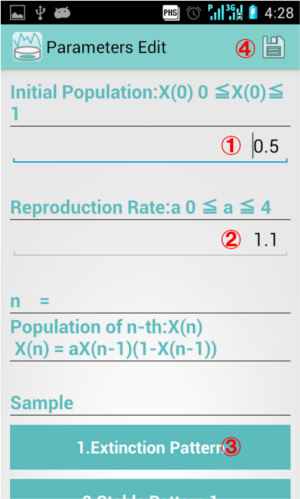
Edit Button
Show "Parameters Edit" Screen. Reference
Type Description
Colony
Population is represented by the size of the Colony. When you start simulation, the size of the colony will change depending on the population.
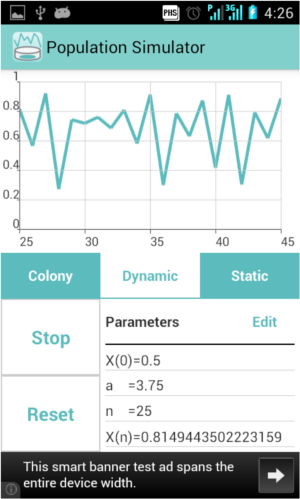
Dynamic Graph
Population is represented by the Line Graph. When you start simulation, Line Graph will display the current population.
Static graph
Show Line Graph of the range of (0 ≦ n ≦ 9999). You can scroll the graph horizontally by Flick.
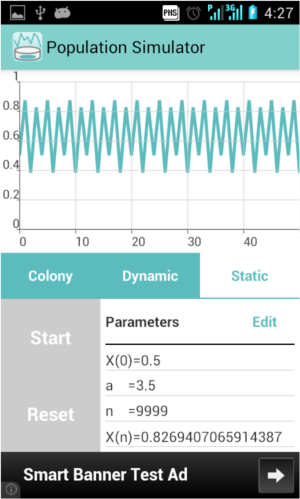 Table of contents
3.Start Simulation
When you press "Start" Button, simulation that is based on the current parameters will be start.
You can pause the simulation by "Stop" Button.
You can reset the values by "Reset" Button.
Table of contents